<img height="1" width="1" style="display:none" src="https://www.facebook.com/tr?id=449369752787427&amp;ev=PageView&amp;noscript=1"> Skip to main content

Know exactly what’s driving production. And what isn’t.

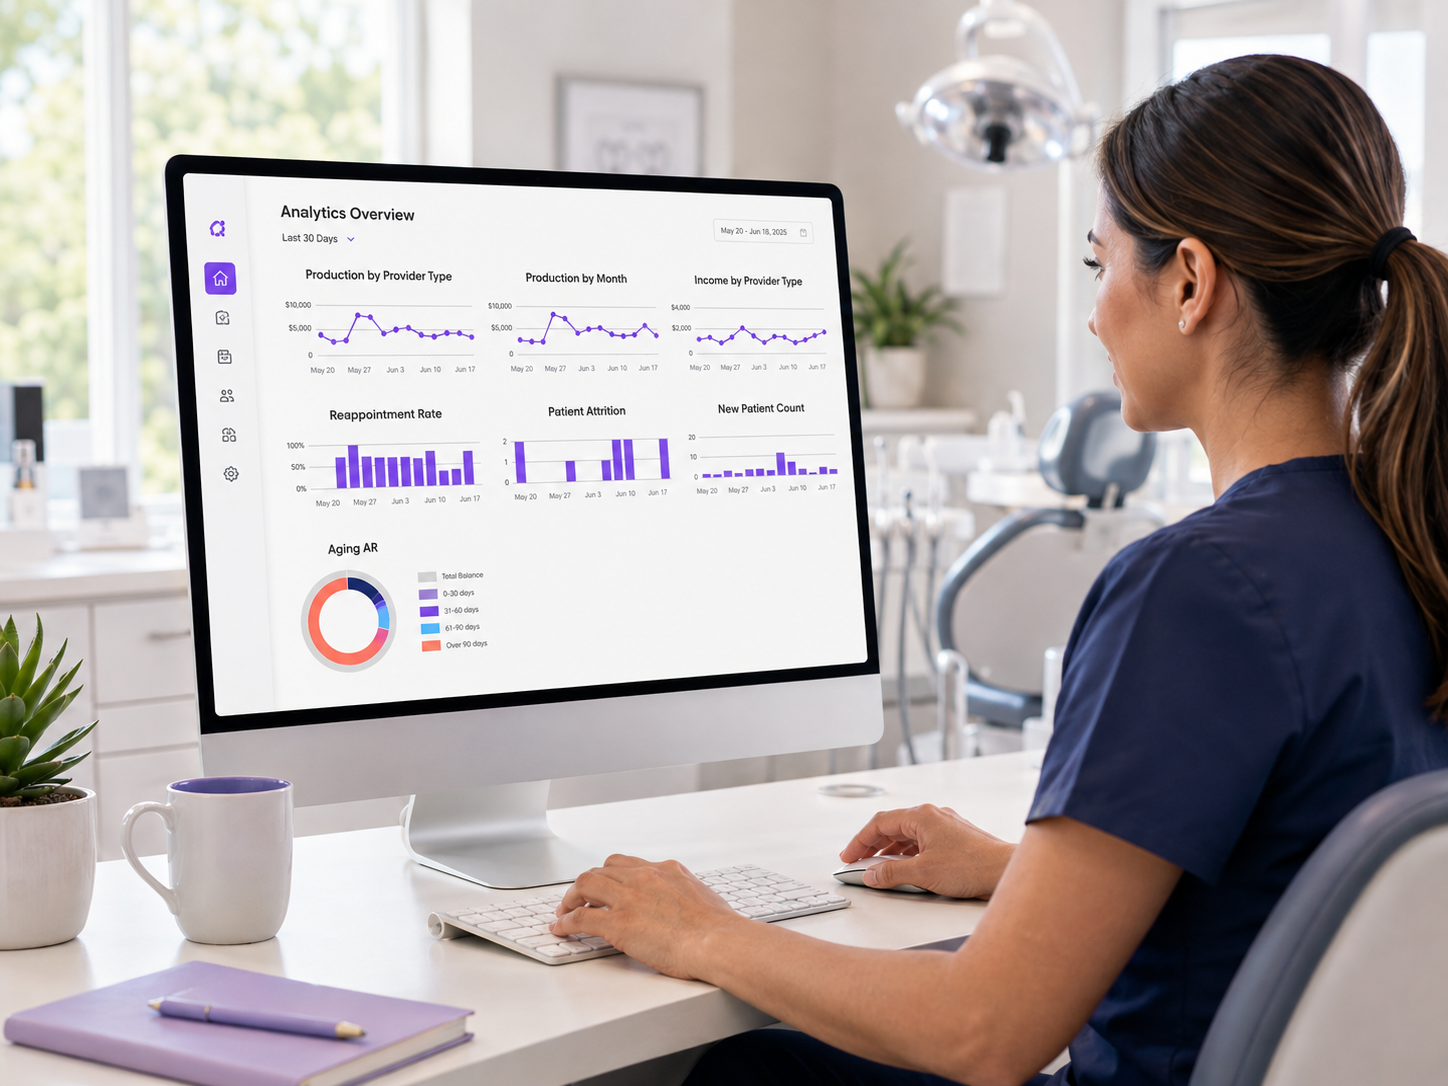
Flex’s production reporting tracks performance by provider, by visit, and over time, straight from your Open Dental data, so you can see where growth is happening before it shows up in a monthly total.
 

Live in two weeks · No data migration · Complimentary team training
Production Reporting for Open Dental Practices

WHAT IT DOES

“It feels busier this month” is not a production number.

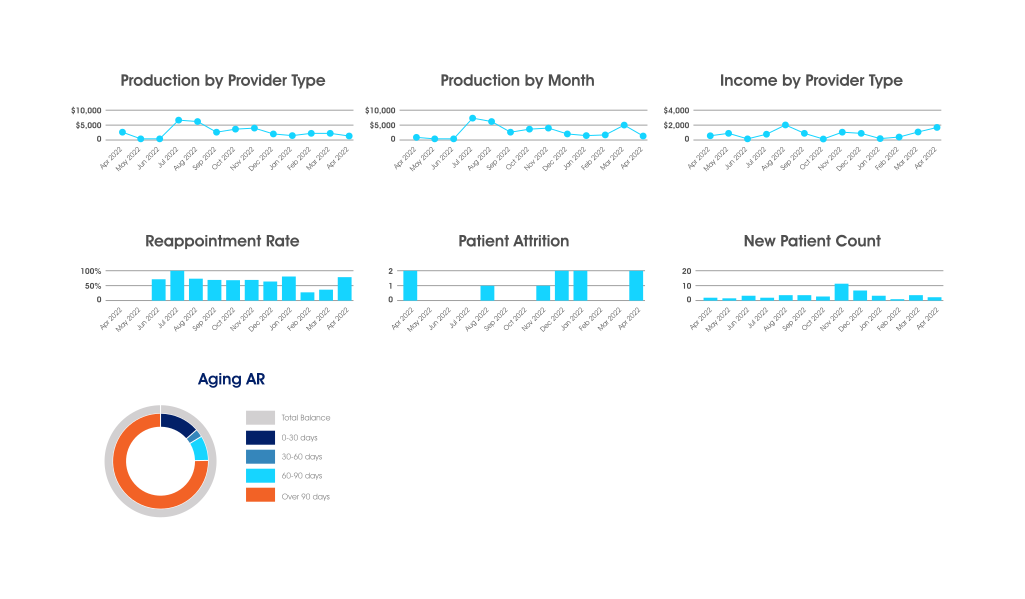
Most practices only find out how production is trending when the month closes and it's too late to change the outcome. By then, a slow week from one provider or a quiet stretch in hygiene has already happened, and there's no way to go back and fix it. Flex's production reporting gives you real-time visibility into production per visit, per provider, and month-over-month, so you can see patterns while they're still forming. Instead of one lagging total, you get a breakdown that shows exactly where production is coming from and where it's falling short.

Every number connects back to the patients and providers behind it, with 12 months of historical data and trend analysis, so you can compare this month to last month, or one provider to another, and know what's actually driving the difference.

64664f13fda06ab503f2220c_Analytics-Dashboard

HOW IT WORKS

Flex turns your Open Dental data into a live production picture.

  1. Flex connects to your Open Dental production data

    Every completed procedure and scheduled visit feeds into your production reporting automatically, with no separate spreadsheet to maintain.

  2. Production breaks down by provider, visit, and time period

    See production per visit and per provider alongside month-over-month trends, so you know whether growth is coming from new patients, existing patients, or a specific provider’s schedule.

  3. You drill into any number to see the patients behind it

    Click a data point to see the individual patients and appointments that make up that number, so a dip or a spike is never a mystery.

WHAT’S INSIDE PRODUCTION REPORTING

Production numbers you can actually act on.

Per-provider production

Compare production across providers to see who’s trending up, who’s trending down, and why.

Month-over-month trends

Track production over time with 12 months of historical data to spot seasonal patterns before they catch you off guard.

Interactive drill-downs

Click any number to see the specific patients and visits behind it, so you can act on what you find instead of just noting it.

WHY FLEX

Built exclusively for Open Dental. That's not a feature — it's the foundation.

Deeper than any integration

Flex doesn't connect to Open Dental — it works alongside it. Every action syncs automatically. Nothing to export, import, or manually update.

Built by people who use Open Dental

Flex was founded by a practicing dentist who ran her own Open Dental practice. Every feature was built to solve a real problem she lived.

Up and running in two weeks

~1 hour install. 2-hour complimentary team training. No downtime, no data migration. From demo to live without disrupting your practice.

Authorized
Integration Vendor

image-3

Ready to know what’s really driving your production numbers?

Flex’s production reporting shows performance by provider, by visit, and over time, straight from Open Dental, so you can spot trends and fix problems before month-end.

Typically responds within 1 business day · No credit card required

FREQUENTLY ASKED QUESTIONS

Questions about Production Reporting

Production reporting tracks how much dentistry your practice is completing, broken down by provider, visit, and time period. Flex builds this directly from your Open Dental data so you always know where production is coming from.

Flex's production reporting reflects your Open Dental activity on an ongoing basis, so you're looking at current performance rather than a report that's weeks old by the time you see it.

Yes. Flex breaks production down by provider so you can see who's trending up, who's trending down, and how each provider's schedule contributes to overall practice production.

Yes. Every production metric includes 12 months of historical data with trend analysis, so you can compare month-over-month performance and identify seasonal patterns instead of reacting to a single month in isolation.

Yes. Flex's interactive drill-downs let you click any production figure to see the individual patients and appointments behind it, so a number is never just a number.

Have more questions? Visit our Help Center